|
|
||||||||||||||||||
Effective Use of Large Visualization Displays
Researchers: Andrew Johnson, Byungil Jeong, Hyejung Hur, Jason Leigh, Khairi Reda, Luc Renambot, Ratko Jagodic
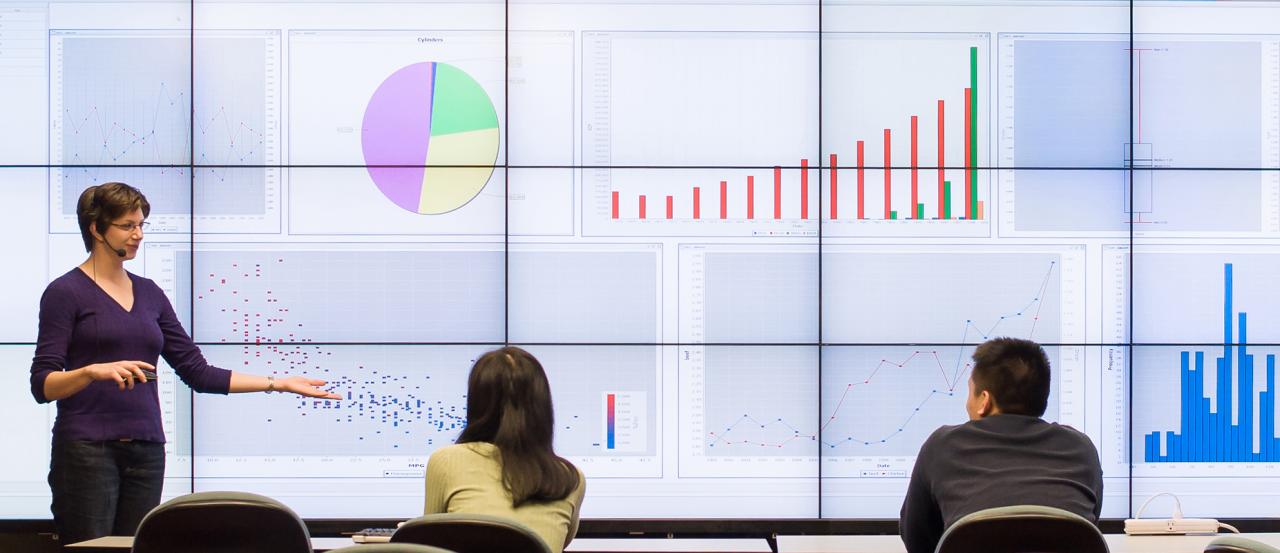
Global-scale cyberinfrastructure, whether sensor nets or supercomputers, is transforming the way teams of scientists and engineers study and understand complex systems - whether physical, geological, biological, environmental, or atmospheric - from the micro to the macro scale, in both time and space. These systems also produce greater volumes of data than ever before, which need to be correlated and interpreted in order for researchers to gain insight and knowledge. This has created a major challenge for researchers, who must now learn to manage the increased scale and complexity of their work. Visualization is still the most effective means for researchers to gain insight - one-third of the human brain is devoted to processing visual information. In the scientific discovery process visualization serves three important roles: it can help to quickly verify the correctness of a complex simulation model during initial development; it can make simulation results more immediately available when tightly integrated with the model; and, it can help make solutions more easily understood by lay audiences. High-resolution displays are becoming common, and graphics cards are able to drive more displays and higher-resolution displays. While the capability to drive these displays is there, this is not enough to create effective collaboration visualization spaces. We are working to create spaces with the following characteristics:
Email: ajohnson@uic.edu Date: January 2, 2002 - Ongoing |