|
|
||||||||||||||||||
Density-based motion
Authors: Etemadpour, R., Forbes, A. G.
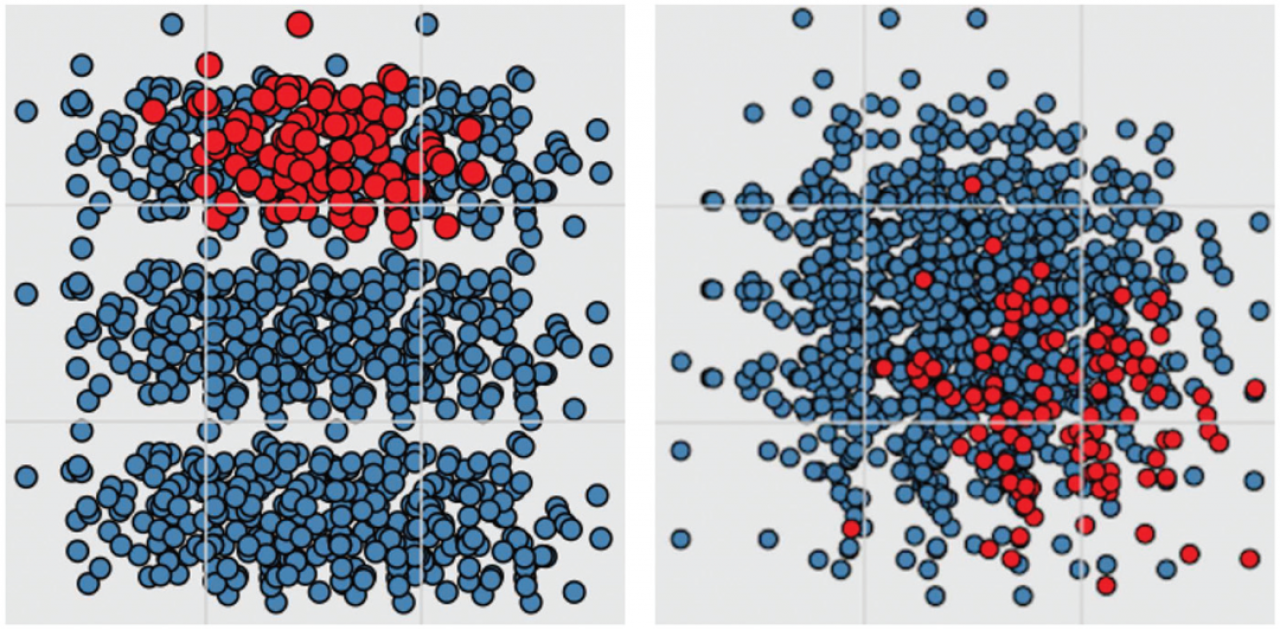
Publication: Information Visualization, SAGE Journals URL: http://ivi.sagepub.com/content/early/2015/10/06/1473871615606187.refs A common strategy for encoding multidimensional data for visual analysis is to use dimensionality reduction techniques that project data from higher dimensions onto a lower-dimensional space. This article examines the use of motion to retain an accurate representation of the point density of clusters that might otherwise be lost when a multidimensional dataset is projected into a two-dimensional space. Specifically, we consider different types of density-based motion, where the magnitude of the motion is directly related to the density of the clusters. We investigate how users interpret motion in two-dimensional scatterplots and whether or not they are able to effectively interpret the point density of the clusters through motion. We conducted a series of user studies with both synthetic and real-world datasets to explore how motion can help users in completing various multidimensional data analysis tasks. Our findings indicate that for some tasks, motion outperforms the static scatterplots; circular path motions in particular give significantly better results compared to the other motions. We also found that users were easily able to distinguish clusters with different densities as long the magnitudes of motion were above a particular threshold. Our results indicate that incorporating density-based motion into visualization analytics systems effectively enables the exploration and analysis of multidimensional datasets. Keywords: Visual analytics, visual clustering, user study, spatial layout, scatterplots, multidimensional visualization, perception Date: October 7, 2015 Document: View PDF |