|
|
||||||||||||||||||
MC1: A Bespoke Analysis Tool for Spatio-temporal Park Traffic Data
Authors: Kirilov, D., Lindmae, I., Burks, A., Ma, C., Marai, G.E.
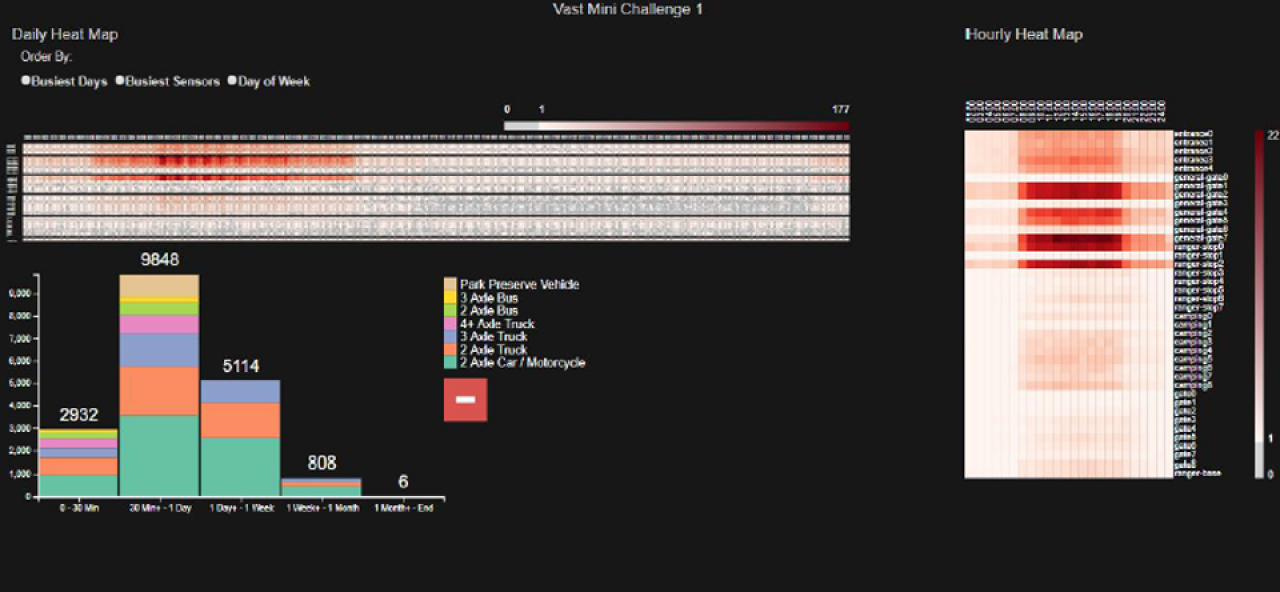
Publication: IEEE Visual Analytics Science and Technology (VAST) Challenge 2017 Proceedings, Phoenix, AZ, pp. 1-2 This paper describes a web-based traffic data analysis tool developed for the VAST 2017 Mini Challenge 1. The tool consists of two linked heat maps which allow for the inspection of daily activity for vehicles, as well as a histogram which allows for the analysis of total time spent by vehicles in the park. Combined, these views allow for the analysis of both spatial and temporal patterns in the park preserve. Date: October 1, 2017 - October 6, 2017 Document: View PDF |