|
|
||||||||||||||||||
Visualizing ensemble time-evolving probability landscapes of stochastic networks
Authors: Ma, C., Burks, A., Luciani, T.Terebus, A., Liang, J., Marai, G.E.
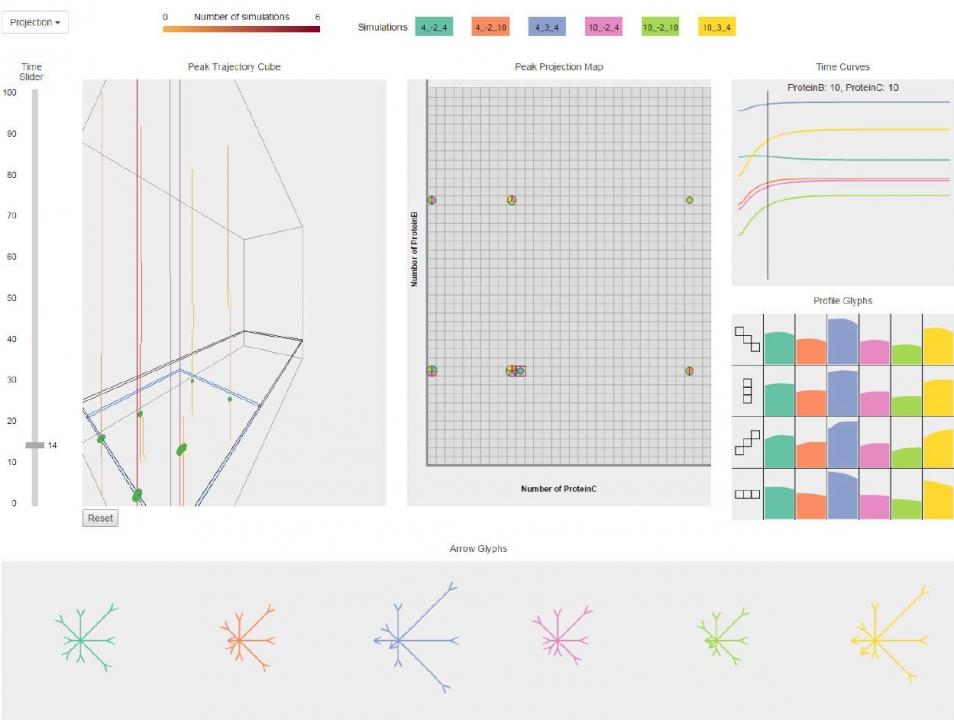
Publication: ISMB/ECCB 2017, BioVis'17, Phoenix, AZ, pp. 1-2 The computational study of the dynamic and stochastic natures of gene regulatory networks is a challenging topic in systems biology. Visualizing ensemble time-evolving probability landscapes of stochastic gene networks can further biologists’ understanding of phenotypic behavior associated with specific genes. We present a web-based visual analysis tool for the exploration of peak distributions over state space and simulation time in such stochastic networks, and the comparison of peak distributions between multiple simulations. Our approach combines multiple linked views to capture ensemble time-evolving probability landscapes. A peak trajectory cube provides users an overview of peak spatiotemporal distributions between six simulations. A peak projection map shows the exact peak locations of multiple simulations at the user selected time. At a more detailed level, users can inspect a particular state in the peak projection map to view for each simulation both the probability values over time, and the local probability landscape shapes. This information is displayed in a small multiple using two glyphs: profile glyphs and arrow glyphs. The arrow glyph indicates that a state is a peak when all the glyph eight arrows point towards the glyph center. In the figure, a disagreement between the arrow glyphs and the peak projection map demonstrates that probability distributions over genes in this system are not independent of each other. Our visual analysis tool allows bioinformatics researchers to explore and compare the time evolving changes of probability landscapes from multiple simulations efficiently, without running many small scripts and computing all characteristics separately. Keywords: Systems biology, Feature detection and tracking, Modelling/Simulation, Ensemble visualization, Spatiotemporal visualization Date: September 29, 2017 Document: View PDF |