|
|
||||||||||||||||||
Patient Cohort Visual Analytics for Post-Treatment Care
Authors: Floricel, C.G.
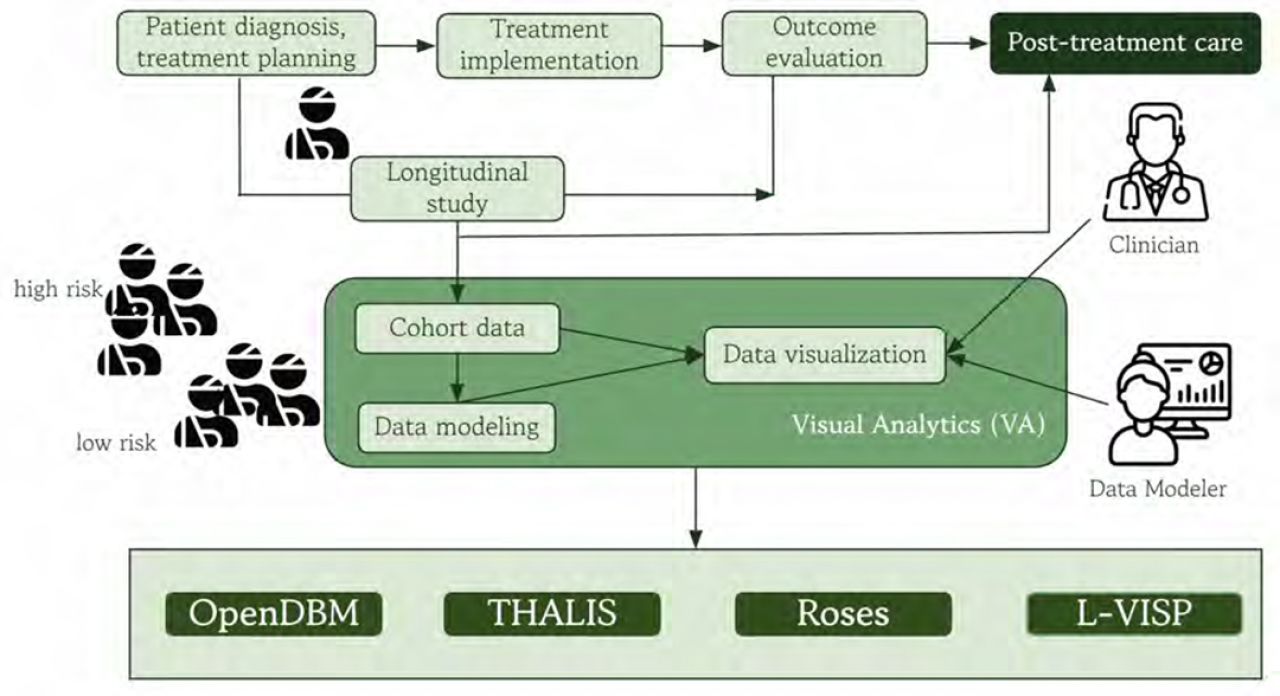
Publication: Submitted as partial fulfillment of the requirements for the degree of Doctor of Philosophy in Computer Science, Graduate College, Chicago, IL Post-treatment decision-making is a process that depends on longitudinal studies of patient cohorts, in which identifying the risk of adverse treatment outcomes is critical to improving personalized care. This process benefits from visual analytics because it can overcome many of the challenges that arise with complex patient cohort data. Visual analytics can help to interpret treatment progressions and outcomes, and stratify cohorts by risk categories, which are crucial for improving treatment decision-making. However, post-treatment cohort analysis uses large-scale, heterogeneous, temporal, multivariate datasets with associated attributes and missing values. Visualization needs to provide scalable, effective methods for cohort analysis at different levels of detail that can uncover patterns and associations among patient attributes that correspond to negative treatment outcomes. Moreover, posttreatment care planning relies on computational cohort data modeling and, as a result, uses both objective and subjective evidence, namely, the clinician’s interpretation of the modeling results. Consequently, cohort modeling and analysis depend on collaborations between clinicians and data modelers. Therefore, visual analytics solutions need to facilitate these collaborations and the interpretation and evaluation of modeling results in a clinical context. I am running a few minutes late; my previous meeting is running over. This dissertation explores visual analytics techniques for cohort modeling and analysis and applies these techniques to post-treatment decision-making. This work addresses the challenges identified above by designing, developing, and evaluating four application-specific visualization systems in collaboration with clinical researchers and data modelers. I first identified the design requirements for a family of cohort modeling problems in cancer symptom and digital biomarker research. Next, I design several systems that integrate unsupervised modeling for the computational back-end and data visualization for the front-end. I propose novel, custom visual encodings for multivariate temporal cohorts that enable iterative risk assessment across cohort stratifications. A first system, OpenDBM, uses visual analytics for behavioral risk assessment in digital biomarker research, using cohorts with hundreds of modeled attributes, and it was designed for the open-source community. This work proposes a novel encoding that aggregates multivariate, spatial, and non-spatial temporal attributes on anatomical locations to explain behavioral biomarkers. A second system, THALIS, shifts the focus to clinician-modeler collaborations in head and neck cancer cohort modeling and to a multi-stage patient monitoring process, namely, during and post-treatment. This system uses scalable visual encodings to interpret attribute associations and introduces a new encoding for evaluating patient outcomes in multivariate, multi-stage time series. A third system, Roses, builds on the previous work, using custom visualizations for the interpretation and evaluation of outcome risk predictions, this time accommodating configurable analytical workflows for clinicians and modelers. The system introduces a visual encoding to summarize multi-stage networks, with temporal nodes, which helps to evaluate patterns and associations in modeled outcome risk components. A fourth system, L-VISP, explores visual analytics for understanding and assessing black-box models in cohort risk prediction, with an emphasis on the design requirements for data modeler activities. To support model evaluation, the system visualizes results for machine-derived (cluster) or user-specified cohort stratifications and introduces custom encodings for weighted associations in multivariate attributes. Together, these systems contribute to data visualization and modeling solutions for the challenges that data modelers and clinicians face during collaborations. Patient records were used for the cancer research projects. These records contained demographic and diagnostic details, as well as longitudinal symptom ratings. The records were anonymized by our clinical expert collaborators and stored on a private institution cloud. Access was limited and given by our collaborators on a case-by-case basis. For the digital biomarker project, the collaborators provided longitudinal biomarker records. These records were extracted from actor, not patient, videos using a feature-extraction toolkit and stored in a private cloud. There were no personal identifiers in these data, and no research involving human subjects was conducted in this dissertation. Date: December 1, 2025 Document: View PDF |