|
|
||||||||||||||||||
Visualizing Large, Heterogeneous Data in Hybrid-Reality Environments
Authors: Reda, K., Febretti, A., Knoll, A., Aurisano, J., Leigh, J., Johnson, A., Papka, M., Hereld, M.
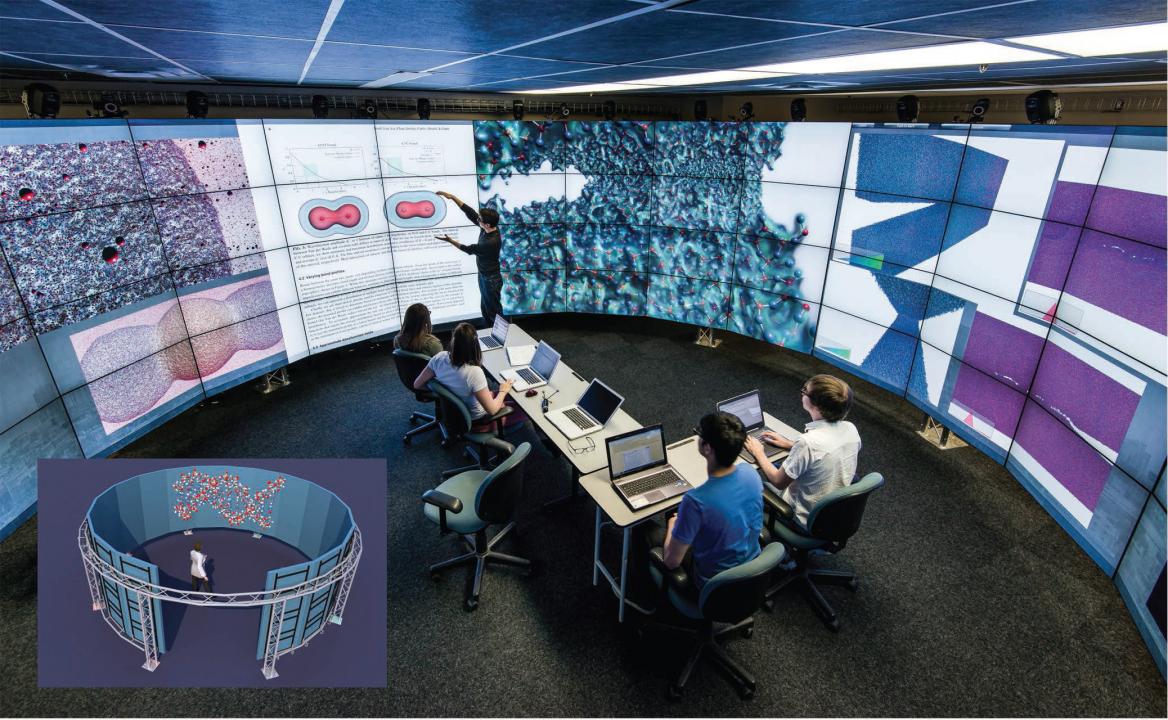
Publication: Computer Graphics and Applications, IEEE, vol 33, no 4, pp. 38-48 URL: http://dx.doi.org/10.1109/MCG.2013.37 Vision is our dominant sense, with roughly a quarter of our brain devoted to processing visual stimuli, providing the highest bandwidth perceptual channel into our cognitive systems. This advanced neural circuitry, shaped by millions of years of evolution, lets us recognize recurring patterns, quickly attend to the unexpected, and visually solve complex spatial and abstract problems. It’s no surprise that early optical instruments were central to many scientific breakthroughs, from Anton van Leeuwenhoek’s discovery of living cells in 1674 using a self-built microscope to Pierre Janssen and Norman Lockyer’s discovery of helium in 1868 via direct observation of solar prominences with a telescope. Much of the data scientists investigate today is digitally created, stored, and analyzed. Scientists are observing phenomena with new types of digital instruments, sensors, and robotic exploration vehicles that can collect data at ever-increasing resolutions. Although this trove of modern digital data isn’t directly amenable to visual observation with traditional optical lenses, visualization lets us transform this data into visual representations. However, despite many recent advances, the scale, heterogeneity, and complexity of modern scientific datasets continue to pose major challenges for visualization designers. In many situations, there are just too few pixels to effectively visualize these datasets. Moreover, solving scientific problems today requires concentrated effort from interdisciplinary teams who deal with various data sources, including 3D, 2D, abstract, temporal, and multidimensional datasets. It’s challenging to construct integrative visualizations that can simultaneously and effectively cater to such a variety of data sources. Just as Leeuwenhoek invented his own lens to look at his water samples four centuries ago, scientists are constructing new types of digital lenses - high resolution computer displays that can effectively be used to visualize large amounts of data. Many scientific disciplines are rapidly adopting modern digital lenses such as the Cyber-Commons and CAVE2, both from the Electronic Visualization Laboratory at the University of Illinois at Chicago. (CAVE stands for Cave Automatic Virtual Environment.) These big lenses let scientists:
Like modern binocular microscopes, the Cyber-Commons and CAVE2 provide high-resolution, stereoscopic display surfaces, creating hybrid-reality (HR) spaces that blur the line between virtual environments and tiled display walls. With their unique characteristics, HR environments empower designers to construct scalable, integrative visualizations that mash up 2D, 3D, temporal, and multivariate data sources. This in turn will allow a new generation of applications better suited to meet the challenges of making sense of today’s increasingly large and heterogeneous datasets. Date: July 1, 2013 - August 1, 2013 Document: View PDF |